
Z scores
Z-score is a statistical measurement that describes a value's relationship to the mean of a group of values.
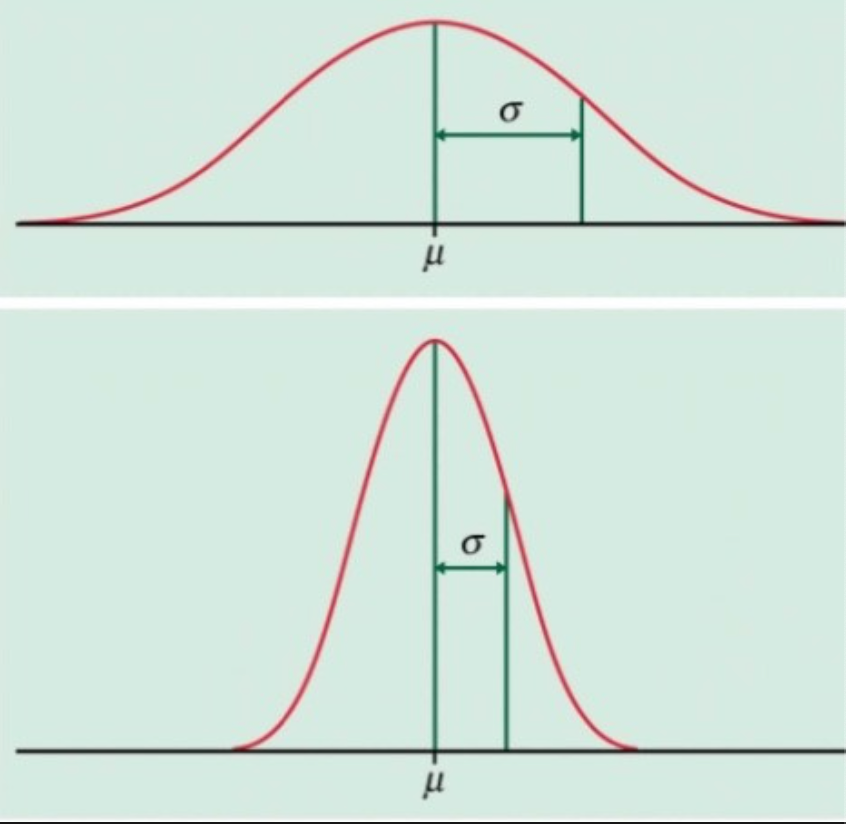
So say we have a bell curve, which represents a set of data, with the mean right in the middle. A z-score tells us how many standard deviations a particular value is from the mean. Positive z-scores indicate values above the mean, while negative z-scores indicate values below the mean.
In the case of MOXO Diagnosis, a z-score of 0 represents the average of the norm population for a specific age and gender, and positive or negative z-scores represent how many standard deviations an individual’s performance score is above or below the mean of their norm group.
The Equation
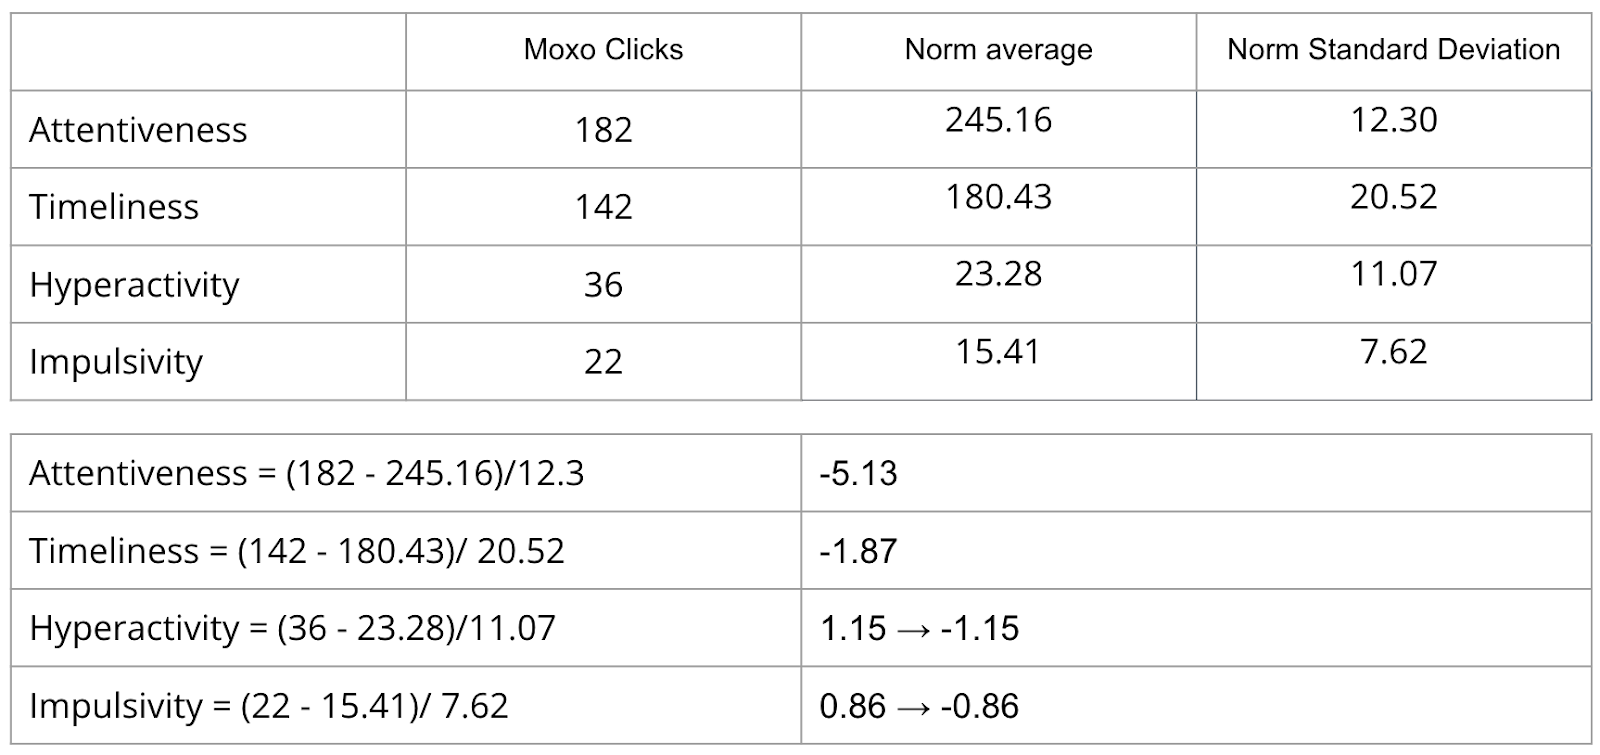
Z score = ( x - μ ) / σ
- x = the MOXO score (number of clicks)
- μ = the mean of the norm group (per age and gender)
- σ = the standard deviation of the norm group (per age and gender)
Example calculation: Participant A: Male 9 years old
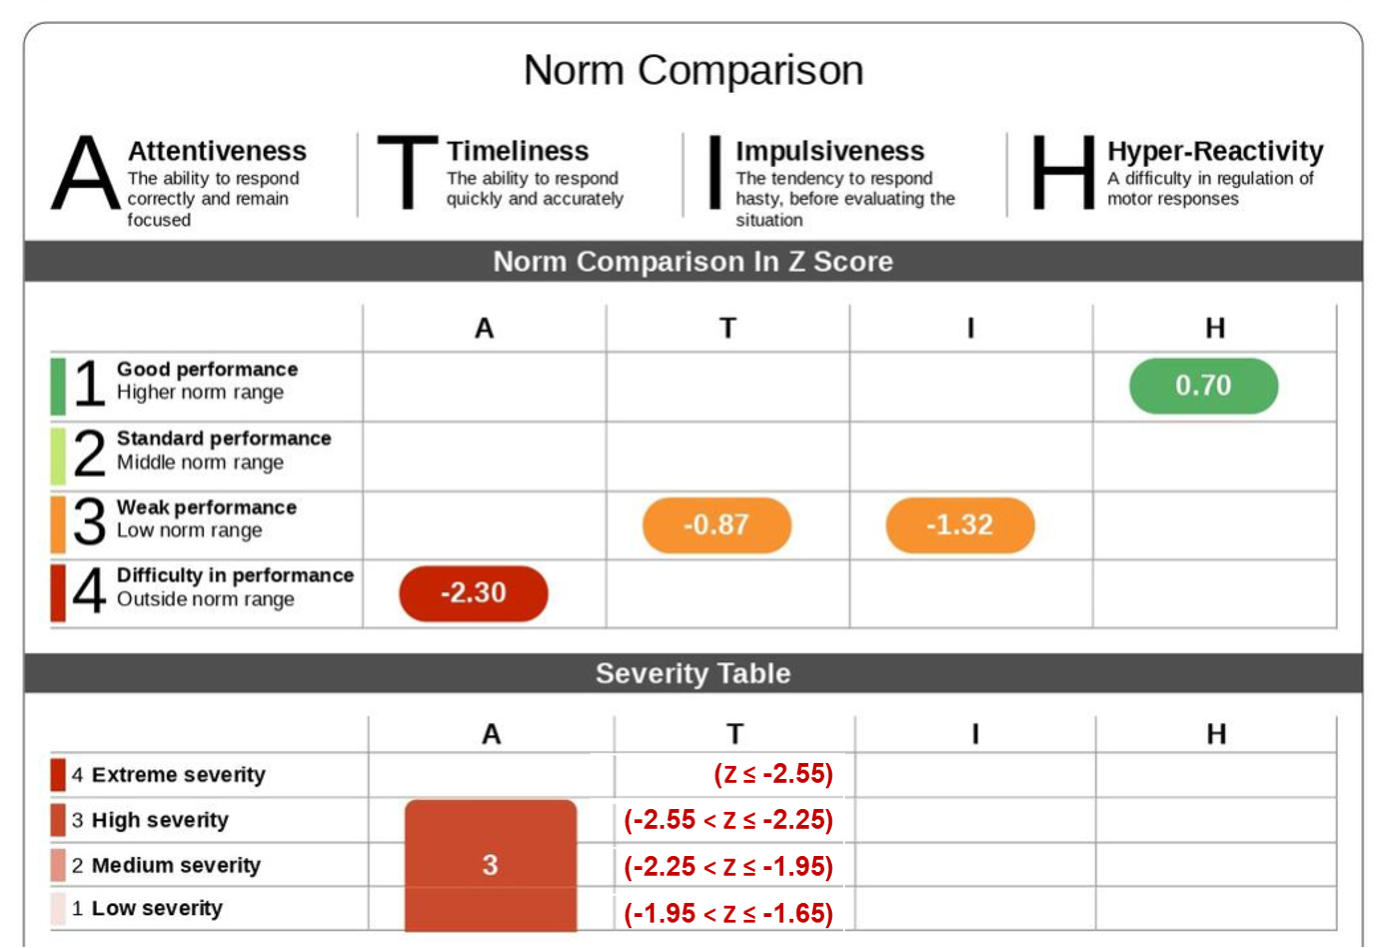
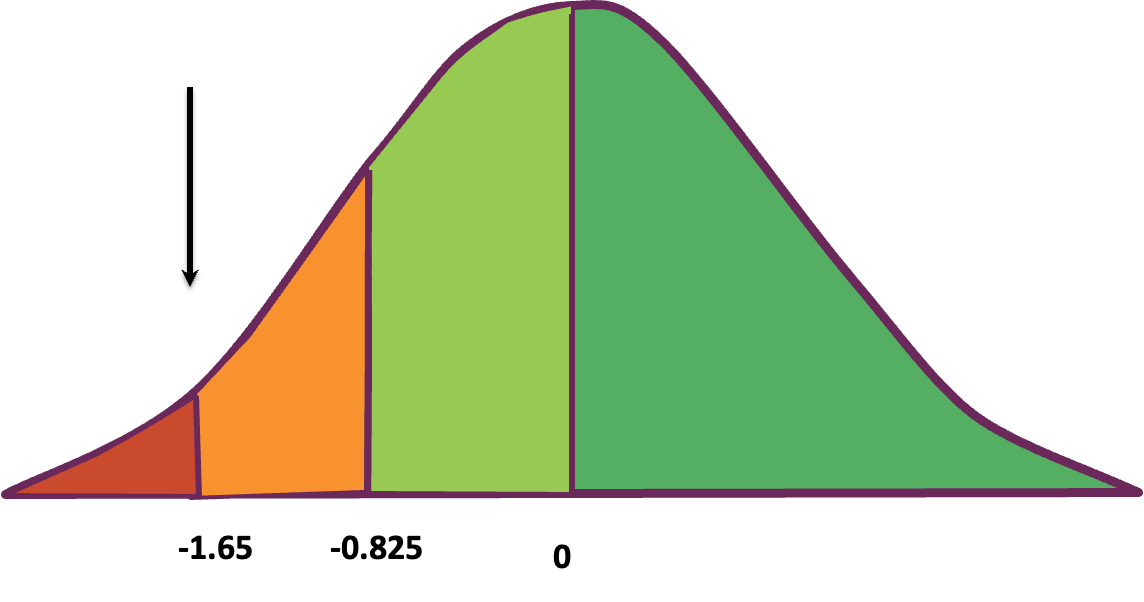
In the MOXO Diagnosis, a score is considered to reflect difficulty in performance if the individual’s z-score falls more than 1.65 standard deviations below the mean of their age and gender matched norm group.
So with that said, why do we use z-scores in the first place? Well, they allow us to compare different sets of data that may have different means and standard deviations. By standardizing our data with z-scores, we can make meaningful comparisons and draw conclusions across different contexts. This allows us to examine all four MOXO Diagnosis metrics- A,T,I and H on a standardized scale and draw conclusions accordingly.